By the end of 2Q 2020, Downtown Boston condo sales transactions were down -24% overall from last year (off 350 units). These numbers were not skewed by a new development closing. In fact, this year’s 22 One Dalton closings and 87 Echelon closings in the first half of the year outnumbered the few One Dalton sales and 70 Pier 4 sales of the first half of 2019. The largest gap in sales for the first half of this year was in the under $500,000 price segment, which was off -48% by the end of 2Q 2020. Whereas $1M+ sales were only off -15% and the middle market ($500,000 – $1M) was off -27%.
Transactions started to trail downward in April, but the biggest impact of the pandemic was felt in May and June. Below is a look at the difference in sales activity under $2M this year compared to last year:
Sales Transactions 2019
| April | May | June | July | August | September | |
| $0- $499,999 | 19 | 29 | 26 | 29 | 33 | 18 |
| $500,000 – $999,999 | 117 | 176 | 160 | 160 | 158 | 93 |
| $1M – $1,999,999 | 66 | 95 | 70 | 70 | 82 | 48 |
Sales Transactions 2020
| April | May | June | July | August | September | |
| $0- $499,999 | 10 | 14 (-52%) | 18 | 27 | 31 | 22 |
| $500,000 – $999,999 | 110 | 77 (-56%) | 102 (-36%) | 166 | 176 | 111 |
| $1M – $1,999,999 | 66 | 38 (-60%) | 67 | 88 | 70 | 62 |
Reduced Inventory Contributes to Reduced Sales
A big contributor to the lag in sales was the drastic reduction in inventory. As the City closed down in March, real estate sellers also took a pause, which meant closings for May and June would inevitably be diminished. As this chart below demonstrates, the overall condo inventory was down -23% this May versus last year.
Downtown Boston Overall Market Inventory
| Units Available 2019 | Units Available 2020 | Percent Change | |
| April | 539 | 438 | -19% |
| May | 605 | 467 | -23% |
| June | 698 | 603 | -14% |
| July | 692 | 779 | 13% |
| Aug | 596 | 911 | 53% |
| Total | 3130 | 3198 | 2% |
Inventory Trends by Price Segment
Within each price segment the percent change in inventory varied. During the first week of March, inventory under $500,000 was off -44% from last year, while $500,000 – $1M was down -22% and $1M- $2M was only off -5%. However, by the middle of May, the inventory under $500,000 climbed back up and was even with last year, while inventory $500,000 – $1M was still down -22%. Inventory $1M-$2M fell further down -18% as many luxury buildings continued to close their doors on real estate agents, showings, and open houses, which in turn caused sellers to take their homes off the market.
A (Very) Late Start to the Spring Market
As the City began to reopen in July, the inventory started to reappear and the buyers came out strong with low interest rates increasing their motivation. The number of condos that went under contract this July was 29% higher than last July. Days to offer this year was a tick faster than last July. And, while the average price of recorded sales this July was 5% lower than last year, the average sale price both years was 99% of list price, which indicates sellers were not dropping prices but rather there was more lower priced inventory for sale this year versus last year. In particular, there was a surge in sales between $600,000 – $900,000 with over 40% more properties selling in this segment this July vs. last July.
By the second week of August, listing services continued to repopulate with condos for sale downtown. Properties that may have been intended for the Spring market began hitting the market in late Summer. The overall inventory in August was up 53% over August 2019. Across each price segment the inventory this August was significantly higher than last year, making up for months of reduced inventory:
- Under $500,000 was up 137% this August from last year
- $500,000 – $1M was up 62%
- $1M+ was up 48%
- ($1M- $2M was up 68%
When inventory increased, sales followed. Under $500,000 inventory jumped 140% from March 2020 to July 2020 to bring the availability back in line to where it was July 2019. In July and August sales contracts for units listed $500,000 and under caught even with June and July of 2019. Sales in the middle market segment of $500,000 – $1M were higher this July and August than the same months last year. The sales $1M- $2M were up 4% for July and August over last year.
While the sales transactions from 2019 to 2020 were off -20% for the condo sales up to $2M by the end of May, the unusually high summer sales activity in July and August has already reduced the difference in sales transactions from last year to this year to -15%. A surge of new inventory coming on the market post-Labor Day and low interest rates may help further close the gap in sales activity from 2019 to 2020 before the year ends.
High End Inventory
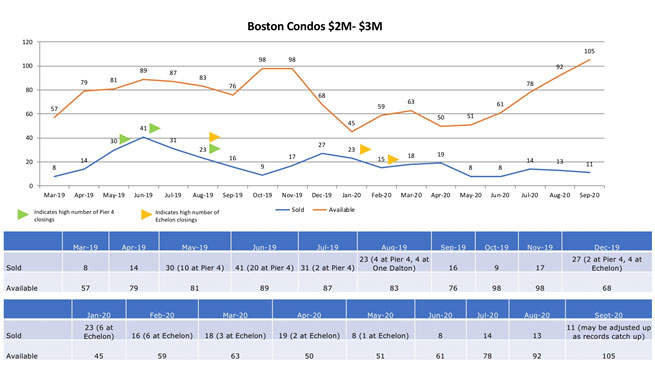
Sales activity in the highest price segments has had a slower bounce back. Sales above $2M are capturing approximately the same percentage of the market as previous years but, with the slower sales pace this year, the number of sales $2M-$3M is still down. Sales transactions over $2M are off -29% overall this year, but accounted for 12% of the market this year versus a slightly higher 14% last year. In April, available inventory $2M+ was -34% off from last year and stayed that way through May. By June, more inventory started to come on the market and the availability was -21% from the previous June. By July the inventory was even with last year, but as more of the would-have-been-Spring inventory came on the market, late summer inventory for $2M+ was 18% higher than last year. As the chart below shows, the gap between sold and available in the $2M – $3M price segment continues to expand. It may be temporary, but the late addition of $2M inventory all at the same time this summer has put buyers in the advantage position heading into the Fall market.
What to expect this Fall
The Fall will be a critical time for Boston’s real estate market. The absorption must keep up with the inventory coming back into the market in order to keep the market balanced. As of late September, we can see sales are picking up. Sales transactions up to $2M are up 23% over sales last September (and may end up even higher as the reporting databases catch up with the end of the month recordings). Even the $2M-$3M segment has started to regain traction. There were 11 $2M- $3M sales this September compared with 13 last year.
Current Available Boston Condo Inventory
| Price Segment | Available Units | Months of Inventory Supply (based on 2019 pace) |
| $0 – $499,999 | 65 | 2.8 |
| $500,000 – $999,999 | 431 | 3.5 |
| $1M – $1,999,999 | 305 | 4.6 |
| $2M- $2,999,999 | 105 | 5.5 |
| $3M – $3,999,999 | 44 | 7.3 |
| $4M – $499,999 | 29 | 7.4 |
3-5 months supply is considered a balanced market. Less than 3 months of
supply is a Seller’s Market and over 5 months of supply is a buyer’s market.
Inventory is at higher levels now than it has been in the last 5 years, but even still it slides the scale into a more balanced market for most price segments rather than a buyer’s market. However, this Fall may present a unique buying opportunity for homeowners who are often disadvantaged by the tight inventory supply. Though it may be a fleeting opportunity, right now buyers find themselves with an equal position to sellers in segments $500,000 – $1M, and this may be as good as a buyer’s position in the Boston condo market gets for quite some time. Buyers in the $2M+ price segments will particularly find themselves in an advantaged position. With the exception of a brief moment in time in 2017 when the $2.5M – $2.99M price segment reached a 5.5 months’ supply of inventory, the available condos under $3M has not reached even a 4 months’ supply level in the last five years. With interest rates at record lows, buyers have strong incentive to get into the market and search for opportunities.